Conference size statistics over time
Information
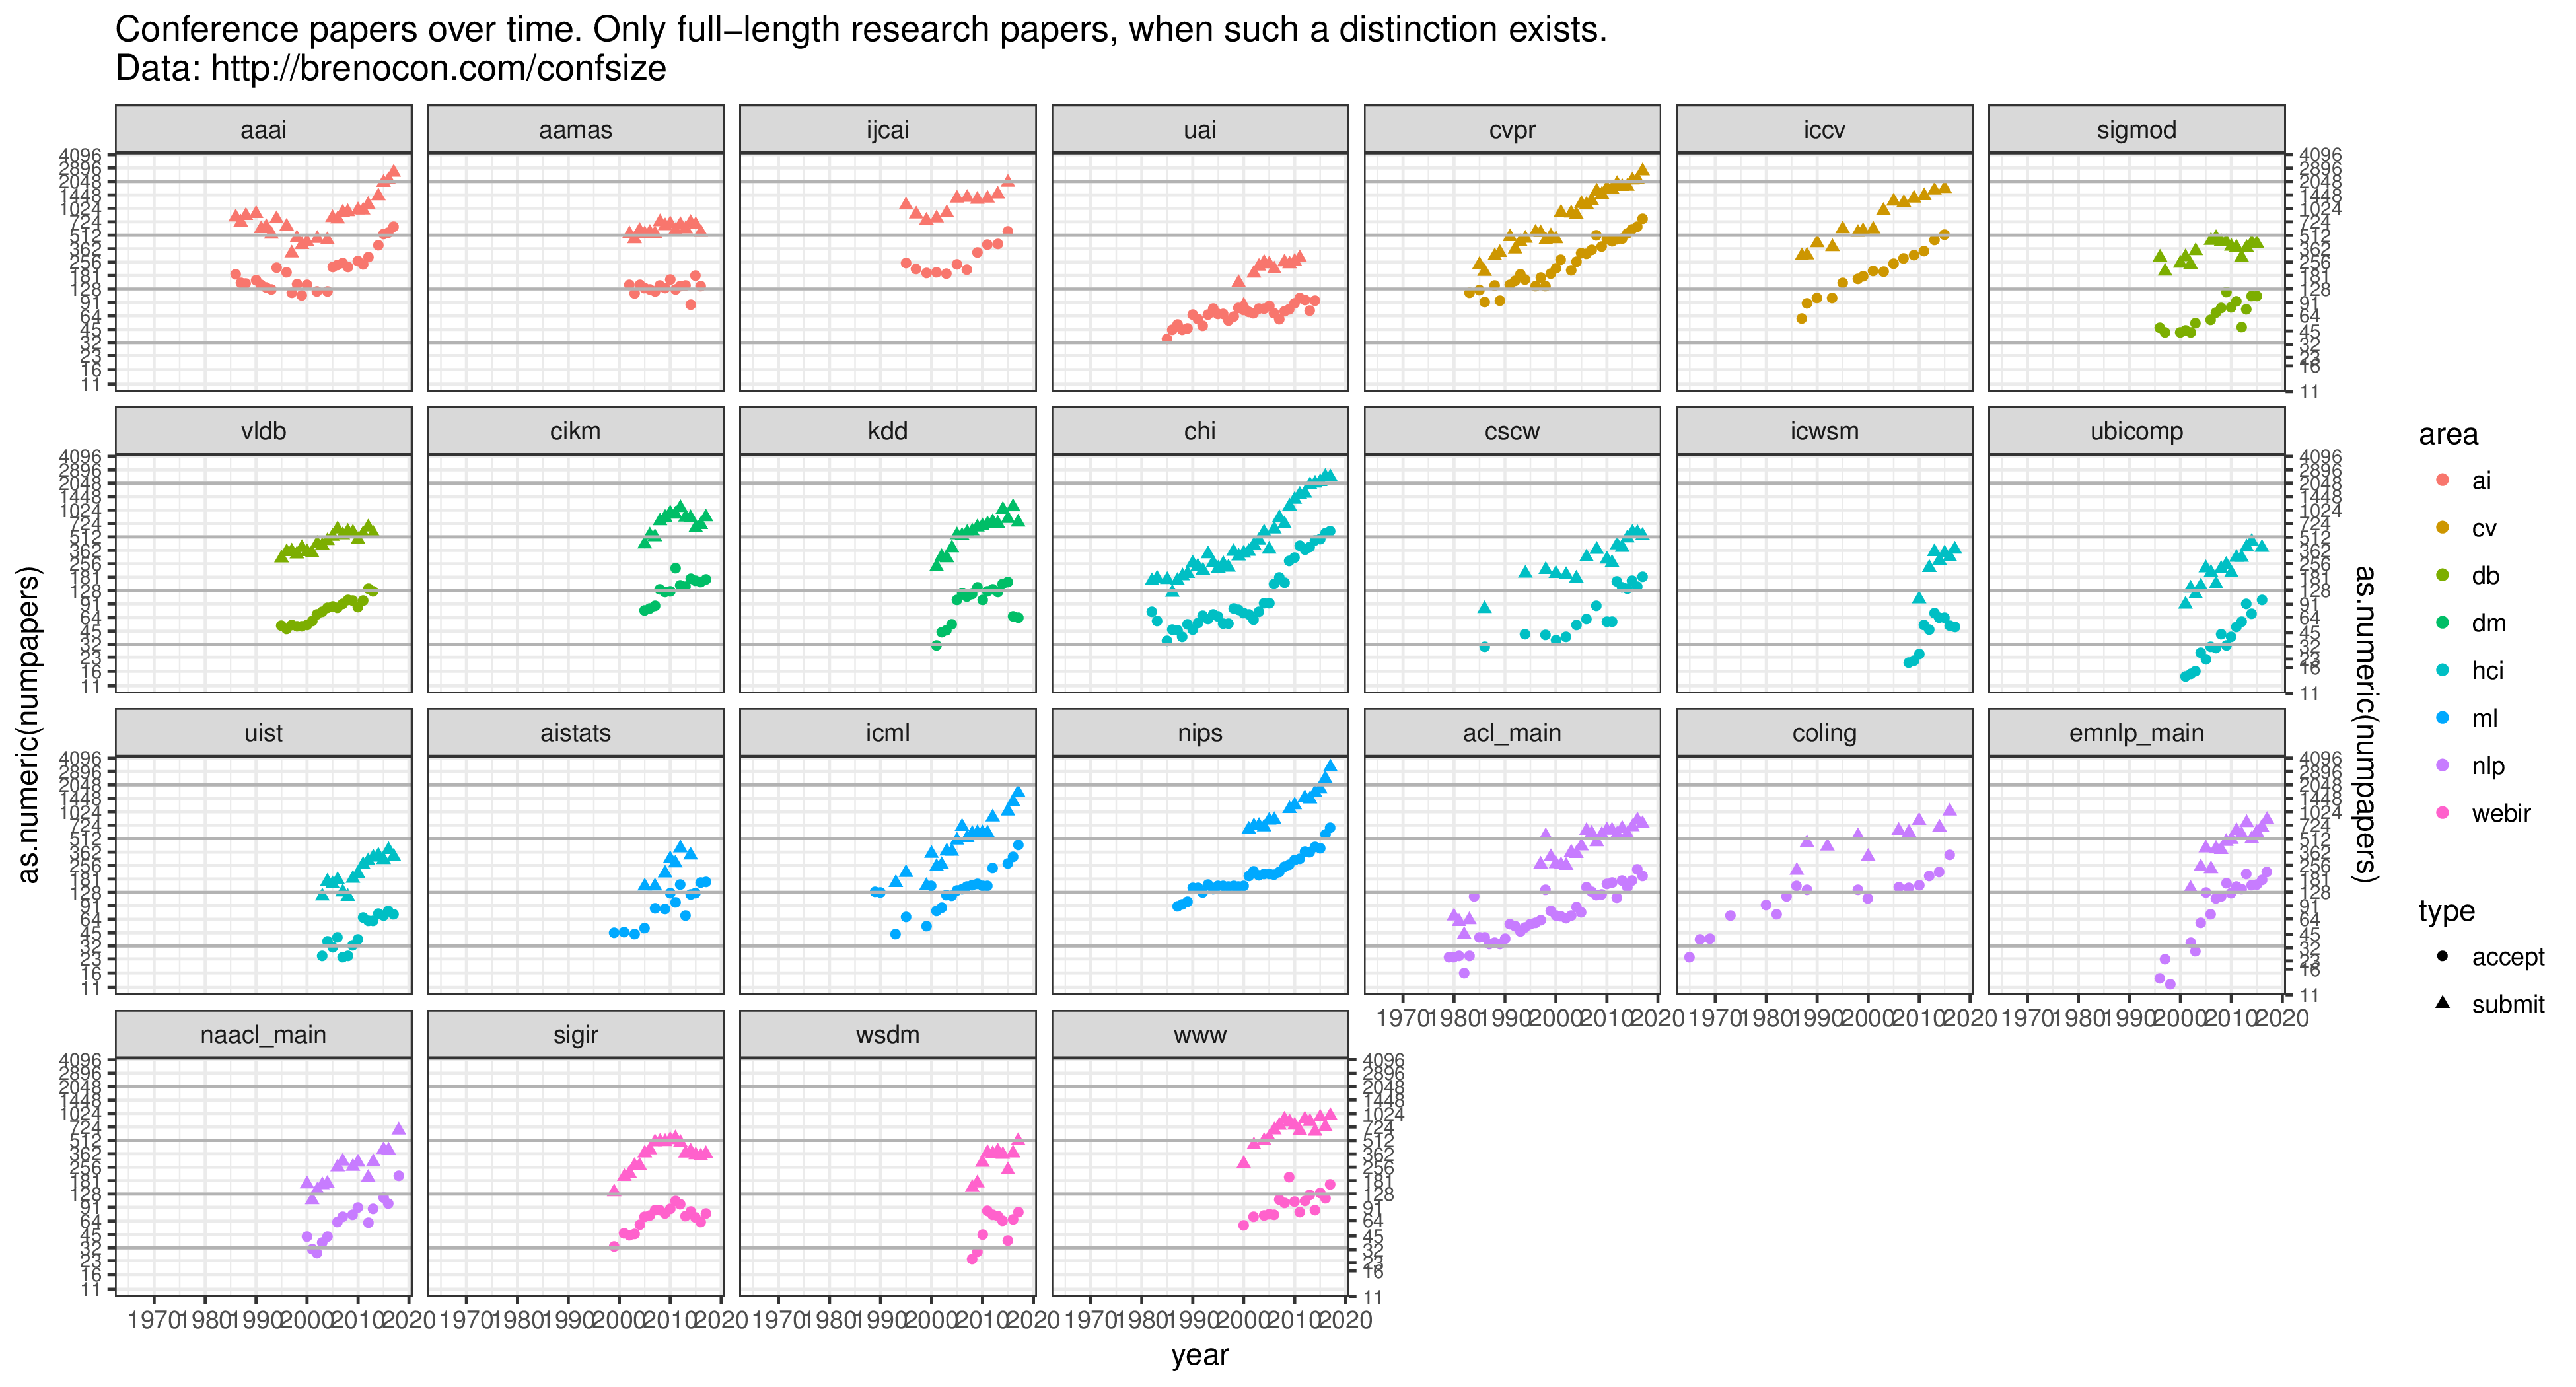
These are the number of paper submissions and acceptances for various CS-related conferences over time, including from AI, ML, HCI, NLP, Vision, Databases, and Data Mining, Web, and IR. Y-axis is a log scale, so acceptance rate corresponds to the vertical space between dots.
Fun notes:
- Recent NIPS growth appears to be super-exponential (?!) or at least,
the relative growth rate increased recently.
- COLING has the oldest history I could find: since 1965.
The biggest caveat is that different data sources may be counting different things.
The intention was to only count acceptances for "full" (as opposed to short papers)
or "main session" (as opposed to demos or workshops)
or "research track" (as opposed to industry track)
papers.
Different places have different definitions and standards for these things;
for example,
sometimes full and short have different submission tracks,
or sometimes they're combined and there are conditional acceptances as different types,
and sometimes this correlates to poster-or-not, etc.
And these standards change over time (for some venues, papers in the 1980s
are often quite a bit shorter than ones today).
Ideally, the counts here would be for what each research community internally
considers to be reasonably high-status publications representing a substantial amount of work. But
I am not familiar with the internal conventions or status designation norms
within most of the communities here, and am hoping the data sources
are a reasonable proxy for that.
Some of the data sources for different conferences include:
- For ACM conferences, I usually used the statistics from ACM Digital Library pages. I could not find explanations for what those numbers mean so I don't know
what types of papers those consider. This source was used for SIGIR, WSDM, KDD, CIKM, and SIGMOD.
- VLDB has its own historical page.
- CVPR and ICCV are from their own historical page.
- SIGCHI has historical pages for many conferences, which I used for CHI, UBICOMP, UIST, and CSCW. For CHI, the numbers are same as the ACM Digital Library's web pages.
- AAAI, IJCAI, and AAMAS are from a variety of sources incuding AAAI and a page by Fei Fang. It's not clear to me what types of papers are counted; I don't know much about these conferences (do they have different sized paper types?)
- For ACL-affiliated conferences, I used either the the ACL Wiki page or sometimes I tried to do counts from the open-access ACL Anthology, or from introductory texts where the program chairs talk about the number of submissions they received. I tried to only count full-length, "main session", non-demo papers. These conferences usually, especially in recent decades, do not make a distinction posters and non-posters. This group includes COLING, IJCNLP, EACL, CoNLL, NAACL, EMNLP, and ACL.
- UAI, AISTATS, ICML, and NIPS are from a variety of sources, usually from their organization's own pages, or their open-access published proceedings.
- In a few cases, especially in earlier periods,
there was no submission count information, but
I counted papers from proceedings TOC or paper listings to get the number of published papers as the acceptance number. This was done for ACL, EMNLP, AISTATS, and NIPS.
- Sometimes, when there was to statistical table available, I found submission counts by reading the proceedings book's introductory remarks from
the program chairs or editors, or from
committee minutes meetings.
They are fun to read; for example The FINITE STRING Newsletter: Minutes of the 1980 ACL Meeting,
or Preface to 2010 ICWSM proceedings.
- ICWSM is mostly from its historical proceedings and introductory texts. The way their introductory texts are written, it seems to be implied that they consider poster aceptances to have less prestige than a normal/full/oral acceptance, so I didn't count those towards the acceptance counts.
The spreadsheet has more precise information on the sourcing, including URLs and attempts to document every data point, and listing multiple contradictory data sources when they exist. Updates and fixes welcome.
Link:
Data and plots
Posted March 2018 by Brendan