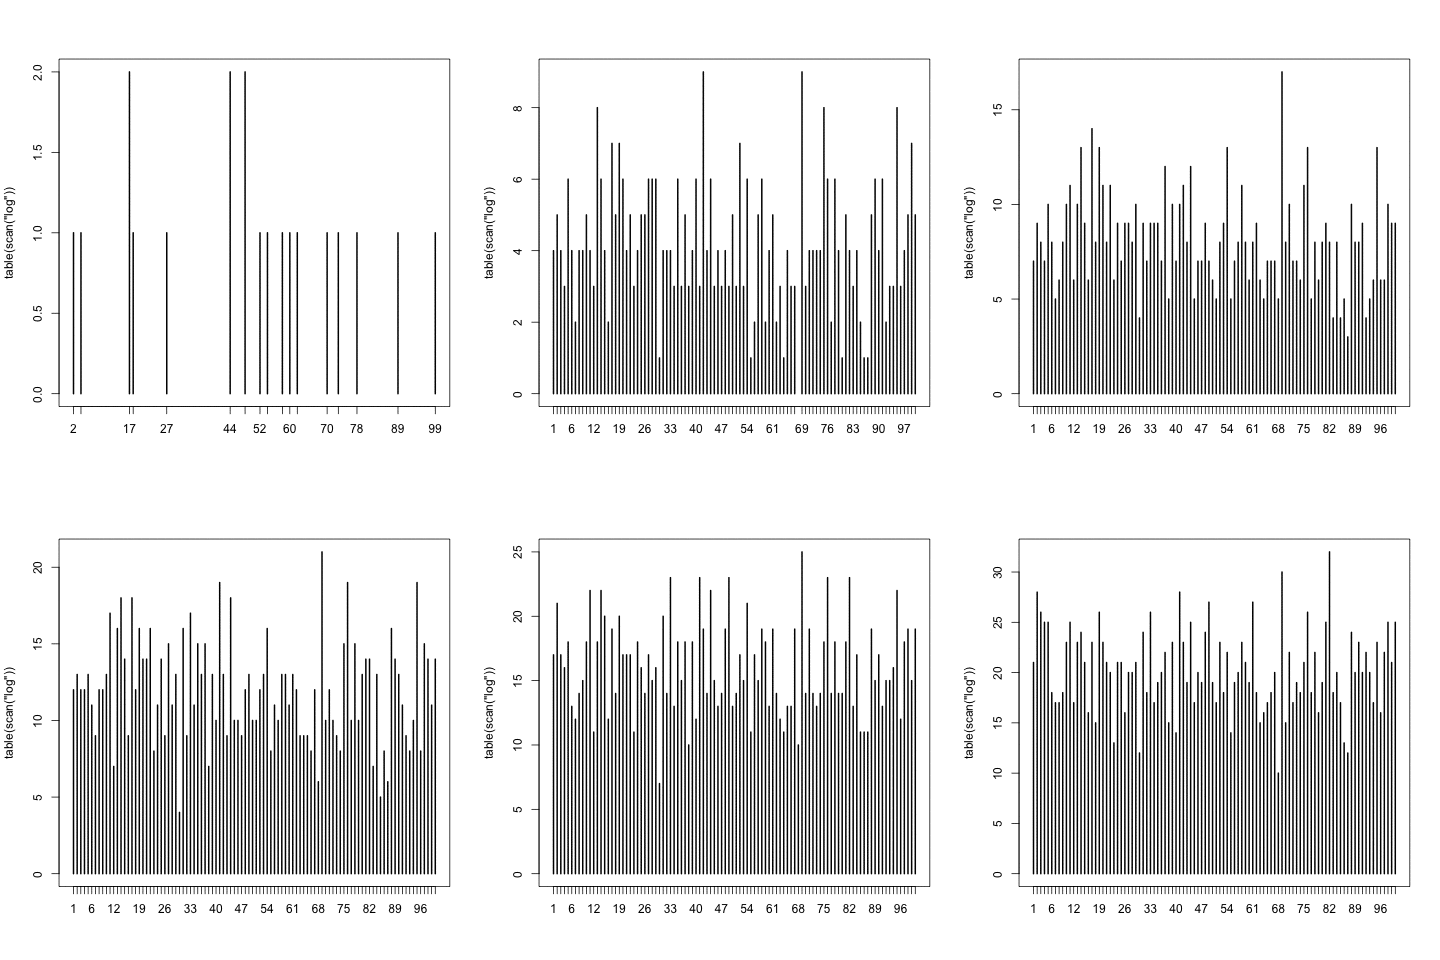
One of my favorite R tricks is scan(). I was using it to verify whether I wrote a sampler recently, which was supposed to output numbers uniformly between 1 and 100 into a logfile; this loads the logfile, counts the different outcomes, and plots.
plot(table(scan(“log”)))
As the logfile was growing, I kept replotting it and found it oddly compelling.

This was useful: in fact, an early version had an off-by-one bug, immediately obvious from the plot. And of course, chisq.test(table(scan(“log”))) does a null-hypothesis to check uniformity.