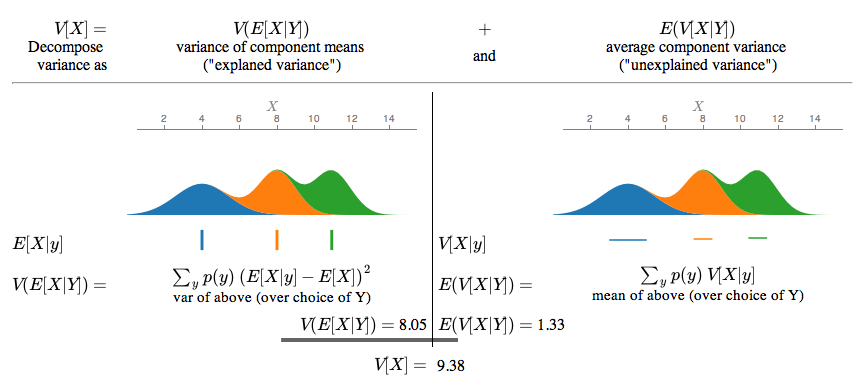
I wrote an interactive visualization for Gaussian mixtures and some probability laws, using the excellent Protovis library. It helped me build intuition for the law of total variance.
About
This is a blog on artificial intelligence and "Social Science++", with an emphasis on computation and statistics. My website is brenocon.com.
Blogroll
Blog Search
-
Archives

hi brend.
clear date visualization .
Change is constant. New packages coming every year .U did Comparison of data analysis packages: R, Matlab, SciPy, Excel, SAS, SPSS, Stata in February 23, 2009. Will u do it once again if there is any changes in it?
sorry its clear data visualization