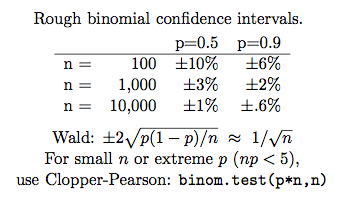
I made this table a while ago and find it handy: for example, looking at a table of percentages and trying to figure out what’s meaningful or not. Why run a test if you can estimate it in your head?

References: Wikipedia, binom.test
I made this table a while ago and find it handy: for example, looking at a table of percentages and trying to figure out what’s meaningful or not. Why run a test if you can estimate it in your head?

References: Wikipedia, binom.test
The 1/sqrt(n) approximation of two standard deviations deteriorates pretty quickly as p moves away from 0.5. It’s off by nearly a factor of 2 for p = 0.9 as indicated in your table. [Also, you need a +/- on the RHS.]
These binomial confidence intervals are defined for i.i.d. samples. This is a particularly lousy assumption for any natural language evaluation involving whole documents, because there’s a huge amount of correlation between words in a document. Given correlation among the items, the confidence intervals need to be fatter because the effective independent sample size is lower. This reduces significance, which may explain why no one ever talks about it.
There’s also sampling variance because the p here are usually only estimated from the corpus, not the entire (super-)population. This also reduces significance.
As we say in CS, “garbage in, garbage out”.
Yeah it’s tricky. I still think it’s useful to build some intuitions about confidence about effect size relative to sample size.
Pingback: Memorizing small tables | AI and Social Science – Brendan O'Connor