I should make a blog where all I do is scatterplot results tables from papers. I do this once in a while to make them eaiser to understand…
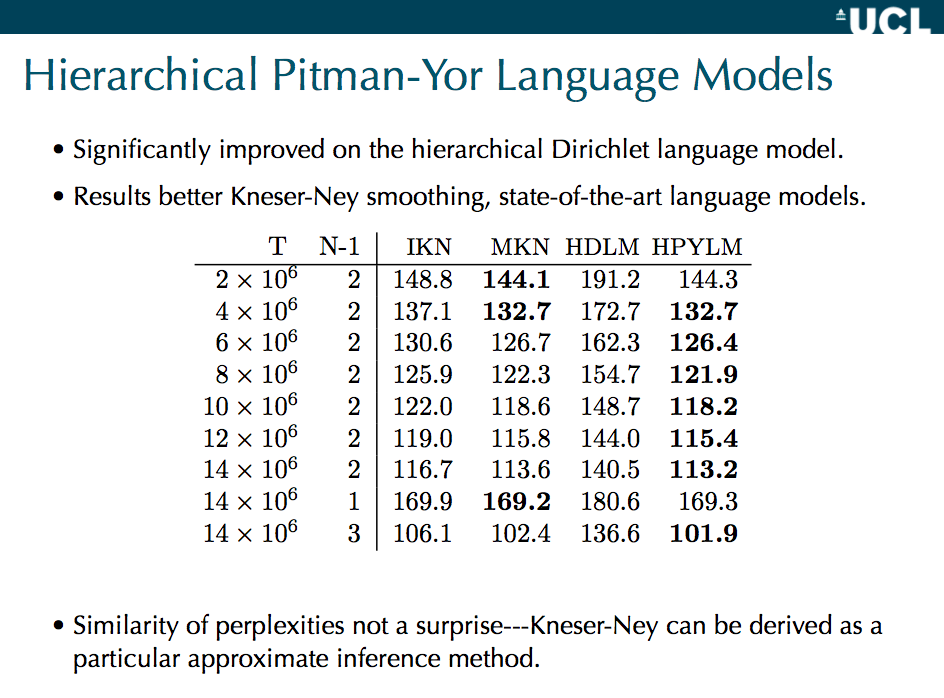
I think the following are results are from Yee Whye Teh’s paper on hierarchical Pitman-Yor language models, and in particular comparing them to Kneser-Ney and hierarchical Dirichlets. They’re specifically from these slides by Yee Whye Teh (page 25), which shows model perplexities. Every dot is for one experimental condition, which has four different results from each of the models. So a pair of models can be compared in one scatterplot.

where
- ikn = interpolated kneser-ney
- mkn = modified kneser-ney
- hdlm = hierarchical dirichlet
- hpylm = hierarchical pitman-yor
My reading: the KN’s and HPYLM are incredibly similar (as Teh argues should be the case on theoretical grounds). MKN and HPYLM edge out IKN. HDLM is markedly worse (this is perplexity, so lower is better). While HDLM is a lot worse, it does best, relatively speaking, on shorter contexts — that’s the green dot, the only bigram model that was tested, where there’s only one previous word of context. The other models have longer contexts, so I guess the hierarchical summing of pseudocounts screws up the Dirichlet more than the PYP, maybe.
The scatterplot matrix is from this table (colored by N-1, meaning the n-gram size):
One thing I’ve noticed about these HPYP LMs is that when you fit the discount parameter, it is quite small for lower order n-grams, so it is well approximated by a DP (and hence, a good justification for why the DPLM does well on the bigram case).