R questions on StackOverflow

R is notoriously hard to learn, but there was just an effort [1] [2] to populate the programming question-and-answer website StackOverflow with content for the R language.

Amusingly, one of the most useful intro questions is: How to search for “R” materials?

Mike Driscoll (who organized an in-person conference event to get this bootstrapped) pointed out that in many ways StackOverflow is a nicer forum for help than a mailing list.  (i.e. the impressive but hard-to-approach R-help.)  It’s more organized, easier to browse, and repetition and wrong answers can get downvoted.  (And more thoughts from John Cook.)

5 Comments

FFT: Friedman + Fortran + Tricks

…is a tongue-in-cheek phrase from Trevor Hastie’s very fun to read useR-2009 presentation, from the merry trio of Hastie, Friedman, and Tibshirani, who brought us, among other things, the excellent Elements of Statistical Learning textbook.  It’s a joy to read sophisticated but well-presented work like this.

This comes from a slide explaining the impressive speed results for their glmnet regression package.  Substantively, I’m interested in their observation that coordinate descent works well for sparse data — if you’re optimizing one feature at a time, and that feature is used in only a small percentage of instances, there are some neat optimizations!

But mostly, I had a fun time skimming the glmnet code.  It’s written in 2008, but, yes, the core algorithm is written entirely in Fortran, complete with punchcard-style, fixed-width formatting!  (This seems gratuitous to me — I thought the modern Fortran-90 had done away with such things?)  I’ve felt clever enough making 10x-100x performance gains by switching from R or Python down to C++, but I’m told that this is nothing compared to Fortran with the proprietary Intel compiler — still the fastest language in the world for numeric computing.

(Hat tip: Revolution Computing pointed out the useR-2009 presentations.)

1 Comment

Beta conjugate explorer

Here’s a little interactive explorer for the beta probability distribution, a conjugate prior for the Bernoulli under Bayesian inference

Ack, too much jargon. Simply press the right arrow every time you see the sun rise, the up arrow when it doesn’t, and opposite directions for amnesia.

I’ve wanted this for a while, an interface that lets you directly control a learning process / play with parameters, and see the effect on posterior beliefs, because I have a poor intuition for all these probability distributions. However, it was never worth actually making this until I tried out using Processing, an amazingly easy-to-use visualization development tool. This is my first Processing app and it was extremely easy to develop — easier than any other graphic/GUI framework I can think of. (Source.) If only java applets didn’t horribly lock up a browser when you open the page…

5 Comments

Michael Jackson in Persepolis

Michael Jackson just died while Iran is in turmoil. I am reminded of a passage in Marjane Satrapi’s wonderful graphic novel Persepolis, a memoir of growing up in revolutionary Iran in the 80′s.

(Read the book to see how it ends.)

I wonder how much coincidences of news event timing can influence perceptions. Clearly, large news stories can crowd out other ones. Are there any other effects of joint appearances? Celebrity deaths are fairly exogenous shocks — there might be a nice natural experiment somewhere here.

2 Comments

Psychometrics quote

It is rather surprising that systematic studies of human abilities were not undertaken until the second half of the last century… An accurate method was available for measuring the circumference of the earth 2,000 years before the first systematic measures of human ability were developed.

–Jum Nunnally, Psychometric Theory (1967)

(Social science textbooks from the 60′s and 70′s are rad.)

2 Comments

June 4

BBC News – June 4, 1989, Tiananmen Square Massacre

Also worth reading: Nicholas Kristof’s riveting firsthand account.

Leave a comment

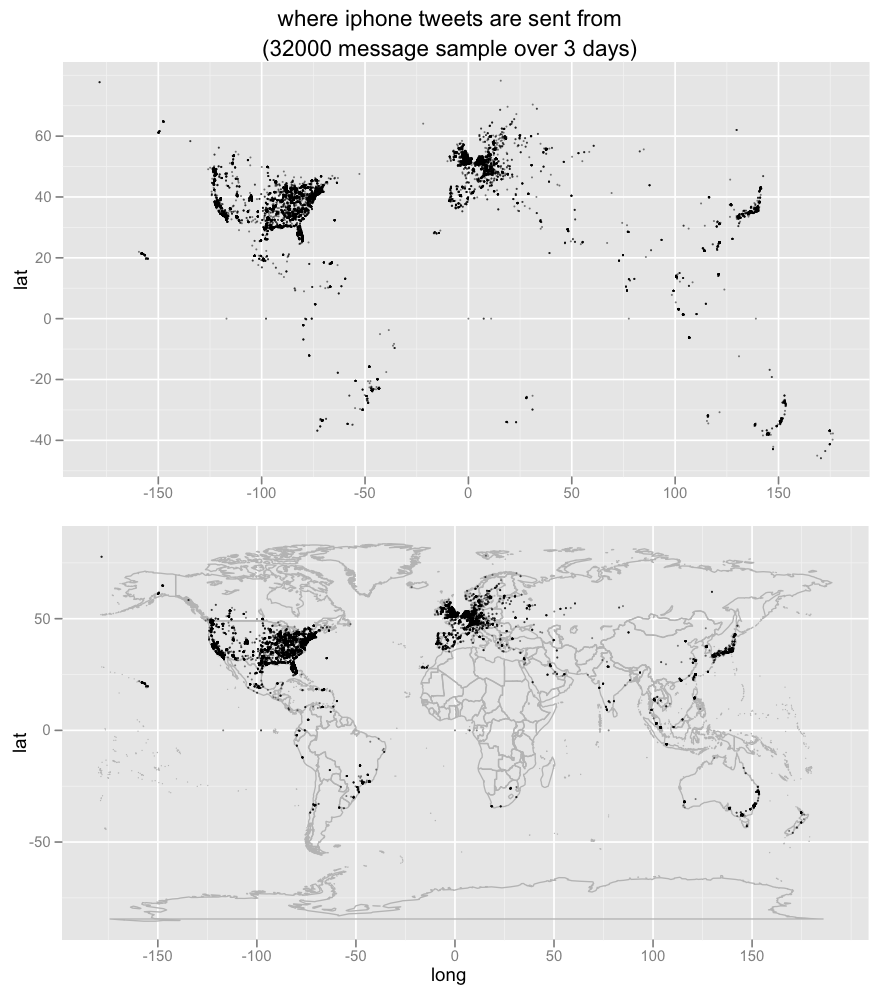
Where tweets get sent from

Playing around with stream.twitter.com/spritzer, ggplot2 and maps / mapdata:

I think I like the top better, without the map lines, like those night satellite photos: pointwise ghosts of high-end human economic development.

This data is a fairly extreme sample of convenience: I’m only looking at tweets posted by certain types of iPhone clients, because they conveniently report exact gps-derived latitude/longitude numbers. (search.twitter.com has geographic proximity operators — which are very cool! — but they seem to usually use zip codes or other user information that’s not available in the per-tweet API data.) So there’s only 30,000 messages out of 1.2 million spritzer tweets over ~3 days (itself only a small single-digit percentage sample of twitter).

Leave a comment

Zipf’s law and world city populations

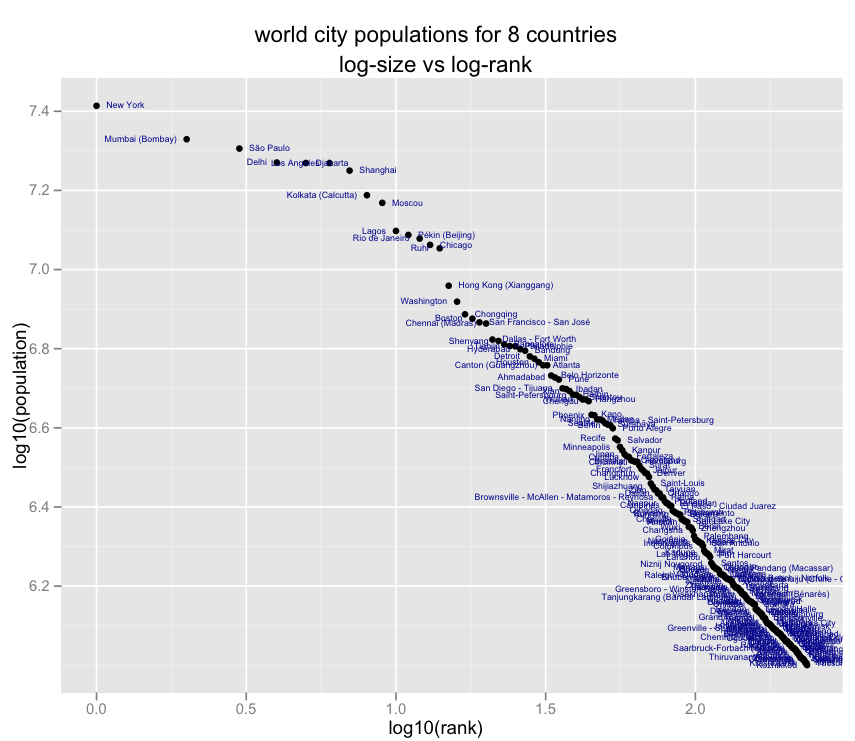
Will Fitzgerald just wrote about an excellent article by Steven Strogatz on Zipf’s Law for the populations of cities. If you look at the biggest city, then the next biggest city, etc., there tends to be an exponential fall-off in size.

I was wondering what this looks like so here’s the classic zipfian plot (log-size vs. log-rank) for city population data from from populationdata.net:

If you fit a power law — that is, a line on the above logsize-logrank plot — you can use rank to predict the sizes of smaller cities very accurately, according to Will’s analysis. Larger cities are more problematic, lying off the line.

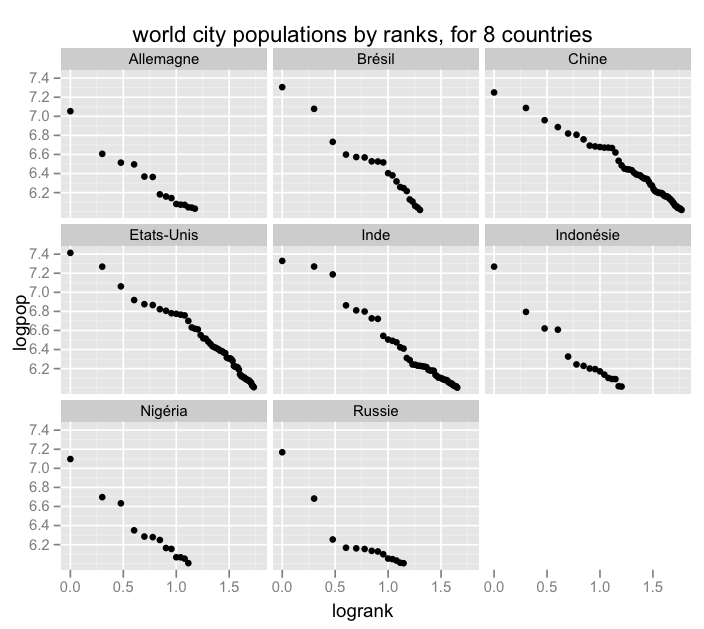
I was curious whether the power law holds within countries as well. The above plot was only for the countries that had more than 10 cities in the dataset — just eight countries. So here are those same cities again, but plotted against ranks within their respective countries.

The answer is — usually, yes, the power law looks like it holds within countries as well. (Country names are French in this data … Etats-Unis = USA, Allemagne = Germany, etc.) Russia seems to have the biggest difference between its head vs. tail cities. The tail cities have the linear logsize-logrank relationship, but the top 3 cities (Moscow, St. Petersburg, Nizhny Novgorod) seem to have their own different slope.

If you randomly subsample out of a Zipf distribution, the samples will be Zipfian as well, so this isn’t too surprising. If, on the other hand, you’re a fan of theories that power law population relationships might happen as a result of the structural dynamics of growth — for example, winners-win (i.e. rich-get-richer) growth patterns can sometimes result in zipf-distributed sizes — then there’s a case that these dynamics might be happening at both the world and country levels.

Also: this is the first time I’ve used Hadley Wickham‘s ggplot2 and it was great. All of the fun of lattice minus a lot of the pain, plus default display options that aren’t ugly as hell :)

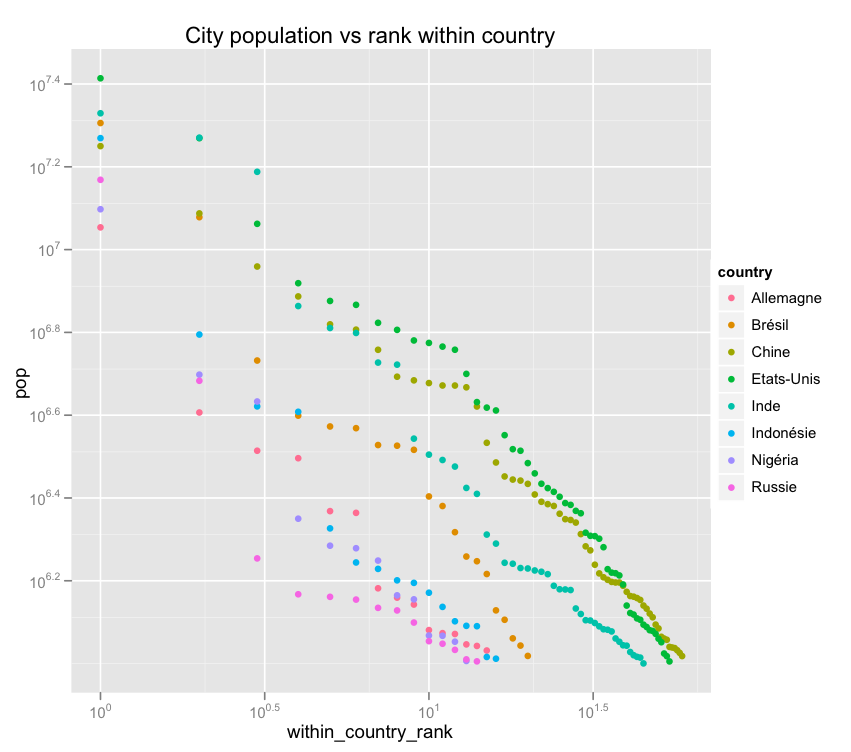
Update: alternative view of those two above graphs.

This was brought to you via the following R code: Continue reading

13 Comments

Announcing TweetMotif for summarizing twitter topics

Update (3/14/2010): There is now a TweetMotif paper.


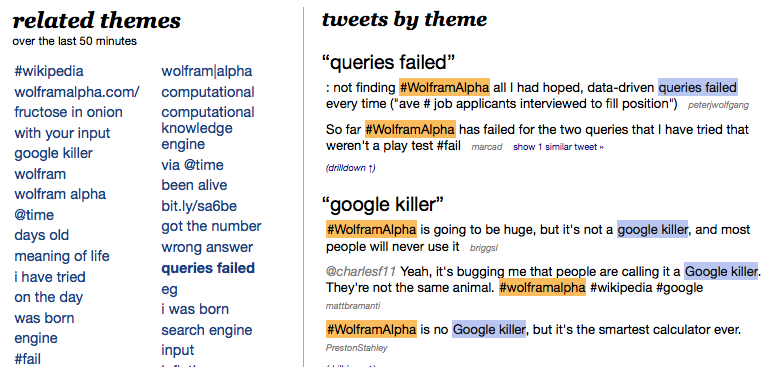
Last week, I, with my awesome friends David Ahn and Mike Krieger, finished hacking together an experimental prototype, TweetMotif, for exploratory search on Twitter. If you want to know what people are thinking about something, the normal search interface search.twitter.com gives really cool information, but it’s hard to wade through hundreds or thousands of results. We take tweets matching a query and group together similar messages, showing significant terms and phrases that co-occur with the user query. Try it out at tweetmotif.com. Here’s an example for a current hot topic, #WolframAlpha:


It’s currently showing tweets that match both #WolframAlpha as well as two interesting bigrams: “queries failed” and “google killer”. TweetMotif doesn’t attempt to derive the meaning or sentiment toward the phrases — NLP is hard, and doing this much is hard enough! — but it’s easy for you to look at the tweets themselves and figure out what’s going on.

Here’s another fun example right now, a query for Dollhouse:


I love that the #wolframalpha topic has “infected” the dollhouse space. Someone pointed out a connection between them, but really they’re connected through bot spam. TweetMotif’s duplicate detection algorithm found 22 messages here where each is basically a list of all the trending topics. This seems to be a popular form of twitter spambots.

I learned a ton making this system, and I’ll try to write more about the technical details in a future post. It’s interesting to hear people speculate on how it works; everyone gives a different answer. I guess this goes to show you that search/NLP is still a pretty unsettled, not-completely-understood area.

There are lots of interesting TweetMotif examples. More prosaic, less news-y queries like sandwich yield cool things like major ingredients of sandwiches and types of sandwiches. (These are basically distributional similarity candidates for synonym and meronym acquisition, though a bit too noisy to use in its current form.) And in a few cases, like for understanding currently unfolding events, TweetMotif might even be useful! It would be nice to expand the set of usefully served queries. We’re occasionally posting interesting queries at twitter.com/tweetmotif.

And oh yeah. We have a beautiful iPhone interface!

Check it out folks. This is a functional prototype, so you can play with it right now at tweetmotif.com.

6 Comments

Performance comparison: key/value stores for language model counts

I’m doing word and bigram counts on a corpus of tweets. I want to store and rapidly retrieve them later for language model purposes. So there’s a big table of counts that get incremented many times. The easiest way to get something running is to use an open-source key/value store; but which? There’s recently been some development in this area so I thought it would be good to revisit and evaluate some options.

Here are timings for a single counting process: iterate over 45,000 short text messages, tokenize them, then increment counters for their unigrams and bigrams. (The speed of the data store is only one component of performance.) There are about 17 increments per tweet: 400k unique terms and 750k total count. This is substantially smaller than what I need, but it’s small enough to easily test. I used several very different architectures and packages, explained below.

architecture name speed

in-memory, within-process python dictionary 2700 tweets/sec

on-disk, within-process berkeleydb hashtable 340 tweets/sec

on-disk, within-process tokyo cabinet hashtable 1400 tweets/sec

in-memory, over socket memcached 120 tweets/sec

on-disk, over socket memcachedb 0.5 tweets/sec

in-memory, over socket tokyo tyrant, memcached protocol 85 tweets/sec

on-disk, over socket tokyo tyrant, memcached protocol 85 tweets/sec

on-disk, over socket tokyo tyrant, binary protocol 225 tweets/sec

Eventually, Continue reading

28 Comments