1 billion web page dataset from CMU

This is fun — Jamie Callan‘s group at CMU LTI just finished a crawl of 1 billion web pages. It’s 5 terabytes compressed — big enough so they have to send it to you by mailing hard drives.

Link: ClueWeb09

One of their motivations was to have a corpus large enough such that research results on it would be taken seriously by search engine companies. To my mind, this begs the question whether academics should try to innovate in web search, when it’s a research area incredibly dependent on really large, expensive-to-acquire datasets. And what’s the point? To slightly improve Google someday? Don’t they do that pretty well themselves?

On the other hand, having a billion web pages around sounds like a lot of fun. Someone should get Amazon to add this to the AWS Public Datasets. Then, to process the data, instead of paying to get 5 TB of data shipped to you, you instead pay Amazon to rent virtual computers that can access the data. This costs less only to a certain point, of course.

It always seemed to me that a problem with Amazon’s public datasets program is that they want data that’s genuinely large enough you need to rent lots of computing power to work on it; but there are very few public datasets large enough to warrant that. (For example, they have Freebase up there, but I think it’s slightly too small to justify that; e.g. I can fit all of freebase just fine on my laptop and run a grep on it in like 5 minutes flat.) But 1 billion web pages is more arguably appropriate for this treatment.

The bigger problem with big-data research initiatives is that organizations with petabyte-scale data are always going to keep it private; e.g. from giant corporations — walmart retail purchase records, or the facebook friend graph, or google search query logs — or else from governments of course. Maybe biology and computational genetics is the big exception to this tendency. At least the public data situation for web research just got a lot better.

6 Comments

Pirates killed by President

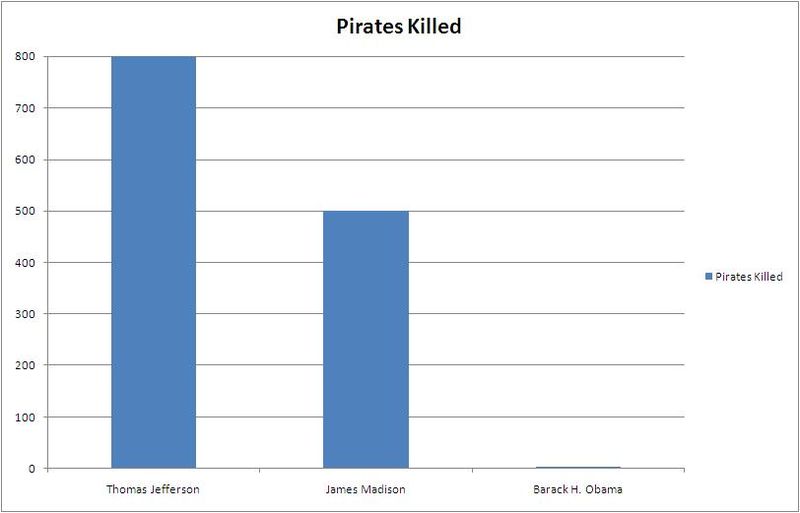
A lesson in x-axis scaling, and choosing which data to compare.  Two current graphs making their rounds on the internet:

(about this.)

Leave a comment

Binary classification evaluation in R via ROCR

A binary classifier makes decisions with confidence levels. Usually it’s imperfect: if you put a decision threshold anywhere, items will fall on the wrong side — errors. I made this a diagram a while ago for Turker voting; same principle applies for any binary classifier.

So there are a zillion ways to evaluate a binary classifier. Accuracy? Accuracy on different item types (sens, spec)? Accuracy on different classifier decisions (prec, npv)? And worse, over the years every field has given these metrics different names. Signal detection, bioinformatics, medicine, statistics, machine learning, and more I’m sure. But in R, there’s the excellent ROCR package to compute and visualize all the different metrics.

I wanted to have a small, easy-to-use function that calls ROCR and reports the basic information I’m interested in. For preds, a vector of predictions (as confidence scores), and labels, the true labels for the instances, it works like this:

> binary_eval(preds, labels)

These are four graphs showing variation of classifier performance as the cutoff changes. Continue reading

5 Comments

Comparison of data analysis packages: R, Matlab, SciPy, Excel, SAS, SPSS, Stata

Lukas and I were trying to write a succinct comparison of the most popular packages that are typically used for data analysis.  I think most people choose one based on what people around them use or what they learn in school, so I’ve found it hard to find comparative information.  I’m posting the table here in hopes of useful comments.

Name Advantages Disadvantages Open source? Typical users
R Library support; visualization Steep learning curve Yes Finance; Statistics
Matlab Elegant matrix support; visualization Expensive; incomplete statistics support No Engineering
SciPy/NumPy/Matplotlib Python (general-purpose programming language) Immature Yes Engineering
Excel Easy; visual; flexible Large datasets No Business
SAS Large datasets Expensive; outdated programming language No Business; Government
Stata Easy statistical analysis No Science
SPSS Like Stata but more expensive and worse

[7/09 update: tweaks incorporating some of the excellent comments below, esp. for SAS, SPSS, and Stata.]

There’s a bunch more to be said for every cell.  Among other things: Continue reading

185 Comments

La Jetee

From here.

2 Comments

“Logic Bomb”

Article:

Fannie Mae Logic Bomb Would Have Caused Weeklong Shutdown | Threat Level from Wired.com.

I love the term “logic bomb”.  Can you pair it with a statistics bomb?  Data-driven bomb?  Or maybe the point is a connectionist bomb.

Leave a comment

SF conference for data mining mercenaries

I got an email from a promoter for Predictive Analytics World, a very expensive conference next month in San Francisco for business applications of data mining / machine learning / predictive analytics.  I’m not going because I don’t want to spend $1600 of my own money, but it looks like it has a good lineup and all (Andreas Weigend, Netflix BellKor folks, case studies from interesting companies like Linden Labs, etc.).  If you’re a cs/statistics person and want a job, this is probably a good place to meet people.  If you’re a businessman and want to hire one, this is probably a bad event since it’s too damn expensive for grad school types.  I am supposed to have access to a promotional code for a 15% discount, so email me if you want such a thing.

John Langford posted a very interesting email interview with one of the organizers for the event, about how machine learning gets applied in the real world.  The guy seemed to think that data integration — getting all the data out of different information systems within an organization and in the same place — is the most critical and hardest step.  This aligns with my experiences.  What machine learning people actually study, the algorithms and models, is often the 2nd or 3rd or lower priority concern in an applications realm, at least for creating a new system.  (Similar points from that Jeff Hammerbacher video — most important thing for Facebook’s internal analytics efforts was data integration, e.g. clever combinations of Scribe and Hadoop).  Important exception is if the research is creating a new domain that didn’t exist before.  But knowing how to improve document classification f-score by another 2% isn’t going to matter too much unless you have a very mature system already.

2 Comments

Love it and hate it, R has come of age

Seeing a long, lavish article about R in the NEW YORK TIMES (!) really freaks me out.

replicate(100,  c(
  "OMG OMG, R is now famous?!",
  "People used to make fun of me for learning R since Splus is SO OLD!",
  "I still hear stories that SAS can do crazy tricks that make me jealous.
  But not enough to attempt learning it."
)[ floor(runif(1, min=1,max=4)) ] )

This blog has been a long-time supporter of this both brilliant and insanely quirky statistical programming environment. Here are some graphs I’ve made in the last year or two that have R code attached:

Learning R is hard because there’s a zillion packages, and the official documentation is reference-oriented.  I’ve never looked at any of the books much.  I think you can get very far with exactly two websites:

  • Quick-R – the best introduction that’s organized by topic, not overly domain-specific, and not overly biased towards the author’s pet package.  Check out the “Advanced Graphics” section for a good time.
  • RSeek.org – searches the documentation, package listings, and most critically, the archives of the amazing user mailing list.  Searching those archives alone is far more useful than any half-assed attempt at documentation — it records the expertise and advice of hundreds of statisticians solving real problems over the last 10 years.  I’ve stumbled upon entire new areas of statistics just by reading the R-help archives.

For a few lucid demonstrations of R’s flaws, see these interesting Radford Neal posts: (1) (2) (3) .  It has way more problems than these, of course.  The core’s development model is too closed-source-y.  There’s horrible repetition and inconsistencies even in the standard library.  I swear I’ve seen its interpreter be even slower then Ruby.  You have to memorize a zillion incomprehensible 3-letter-acronyms when making a final draft plot.

But yet it is still great.  R takes one problem — programmatic single-machine data analysis — and solves it well, using a nice Scheme-like language, plus an impressive user community to boot.

6 Comments

Facebook sentiment mining predicts presidential polls

I’m a bit late blogging this, but here’s a messy, exciting — and statistically validated! — new online data source.

My friend Roddy at Facebook wrote a post describing their sentiment analysis system, which can evaluate positive or negative sentiment toward a particular topic by looking at a large number of wall messages. (I’d link to it, but I can’t find the URL anymore — here’s the Lexicon, but that version only gets term frequencies but no sentiment.)

How they constructed their sentiment detector is interesting.  Starting with a list of positive and negative terms, they had a lexical acquisition step to gather many more candidate synonyms and misspellings — a necessity in this social media domain, where WordNet ain’t gonna come close!  After manually filtering these candidates, they assess the sentiment toward a mention of a topic by looking for instances of these positive and negative words nearby, along with “negation heuristics” and a few other features.

He describes the system as high-precision and low-recall. But this is still useful: he did an evaluation against election opinion polls, and found the system’s sentiment scores could predict moves in the polls! It’s more up to date information than waiting for the pollsters to finish and report their polling.
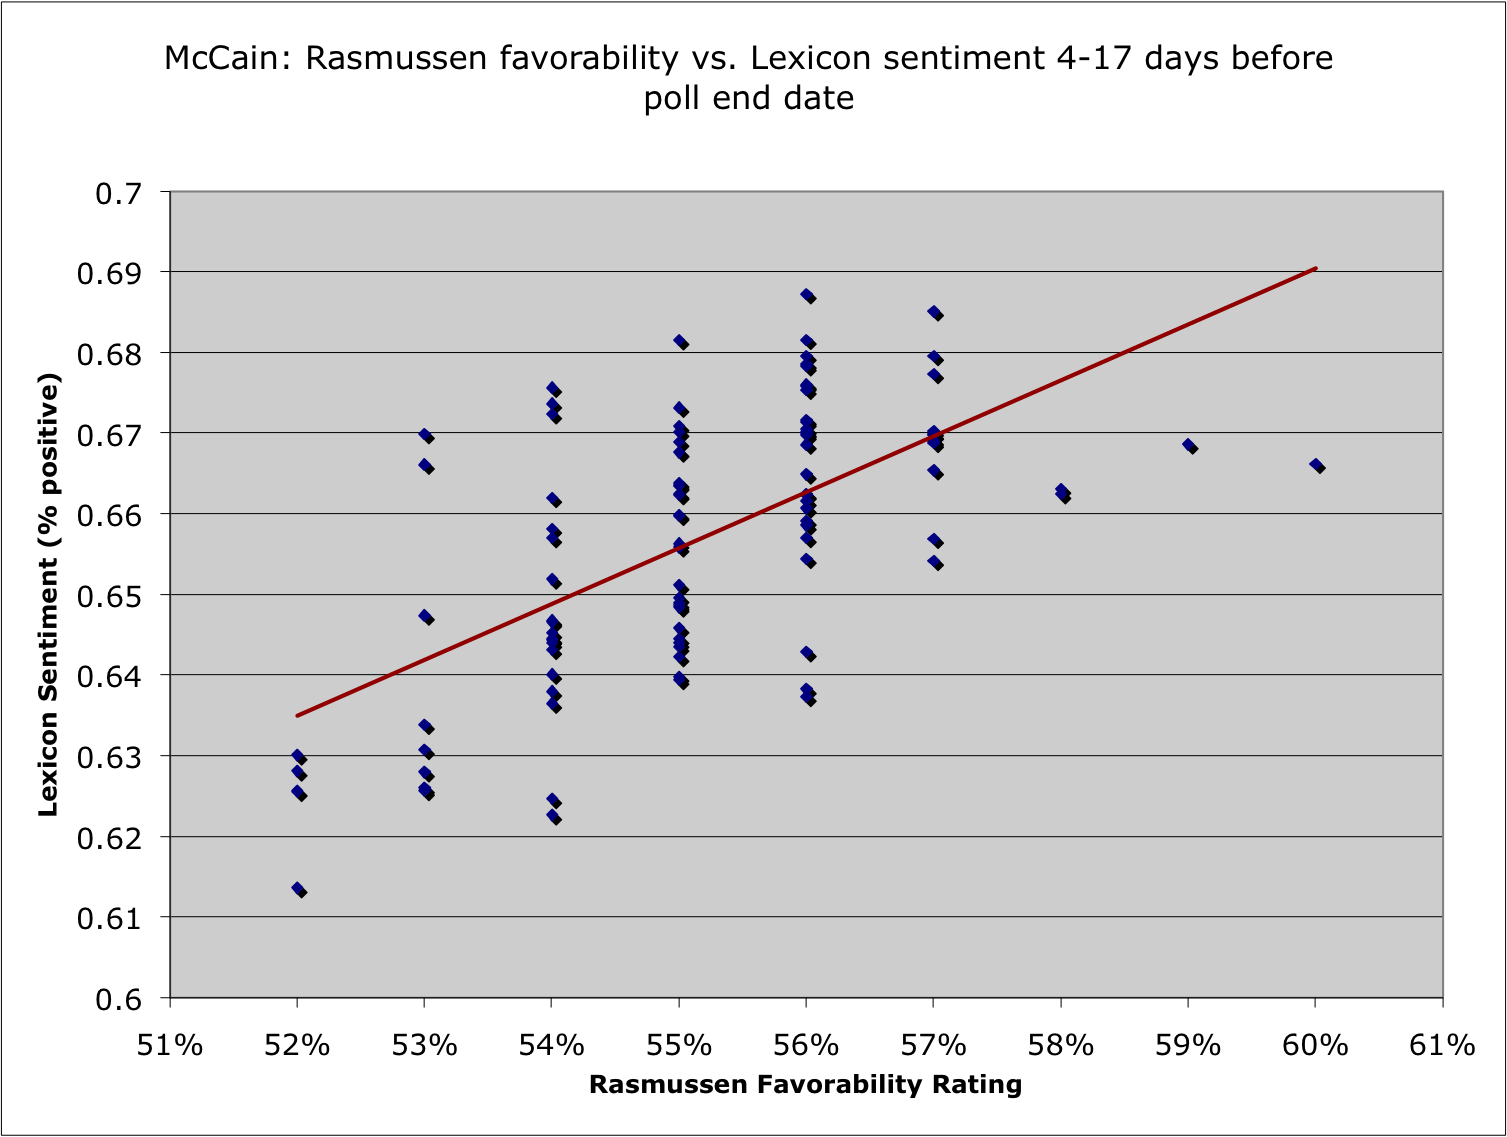
With a few more details to ensure the analysis is rigorous, I think this is a good way to validate whether an NLP or other data mining system is yielding real results: try to correlate its outputs with another, external data source that’s measuring something similar. Kind of like semi-supervised learning: the entire NLP system is like the “unsupervised” component, producing outputs that can be calibrated to match a target response like presidential polls, search relevance judgments, or whatever. You can validate SVD in this way too.

I wanted to comment on a few points in the post:

We got > 80% precision with some extremely simple tokenization schemes, negation heuristics, and feature selection (throwing out words which were giving us a lot of false positives). Sure, our recall sucked, but who cares…we have tons of data! Want greater accuracy? Just suck in more posts!

Let’s be a little careful what “greater accuracy” means here… I agree that high-precision, low-recall classifiers can definitely be useful in a setting where you have a huge volume of data, so you can do statistically significant comparisons between, say, “obama” vs “mccain” detected sentiment and see changes over time. However, there can be a bias depending on what sort of recall errors get made. If your detector systematically ignores positive statements for “obama” more so than “mccain” — say, Obama supporters use a more social media-ish dialect of English that was harder to extract new lexical terms for — then you have bias in the results. Precision errors are always easy to see, but I think these recall errors can be difficult to assess without making a big hand-labeled corpus of wall posts.

(Another example of high-precision, low-recall classifiers are the Hearst patterns for hypernymy detection; take a look at page 4 of Snow et al 2005. I wonder if hand-crafted pattern approaches are always high-precision, low-recall. If that’s so, there should be more work to figure out how to practically use them — thinking of them as noisy samplers — since they’ll always be a basic approach to solving simple information extraction problems.)

And,

Had we done things “the right way” and set about extracting the sentiment terms from a labeled corpus, we would have needed a ton more hand-labeled data. That costs time and money; far better to bootstrap and do things quick, dirty and wrong.

When was this ever “the right way”? This certainly is a typical way for researchers to approach these problems, since they usually rely on someone like the LDC to release labeled corpora. (And therefore control their research agendas, but that’s another rant for another post. But then at least everyone can compare their work to each other.) Also, note that hand-labeled data is way cheaper and easier to obtain than it used to be.

In any case, final results are what matter and there’s some evidence this two-step technique can get them. The full post: Language Wrong – Predicting polls with Lexicon.

7 Comments

Information cost and genocide

In 1994, the Rwandan genocide claimed 800,000 lives.  This genocide was remarkable for being very low-tech — lots of non-military, average people with machetes killing their neighbors.  Romeo Dallaire, the leader of the small UN peacekeeping mission there, saw it coming and was convinced he could stop much of the violence if he had 5,000 international troops plus the authority to seize weapon caches and do other aggressive intervention operations. Famously, he made a plea to his superiors and was denied. (The genocide ended only when a rebel army managed a string of military victories and forcibly stopped the killing.)


Kofi Annan forbade him from expanding his peacekeeping mandate because there was no international support — in particular, the U.S. was not on board. A recent article from The Economist explains, Continue reading

Leave a comment