Everyone recently seems to be talking about this newish paper by Digrazia, McKelvey, Bollen, and Rojas (pdf here) that examines the correlation of Congressional candidate name mentions on Twitter against whether the candidate won the race. One of the coauthors also wrote a Washington Post Op-Ed about it. I read the paper and I think it’s reasonable, but their op-ed overstates their results. It claims:
“In the 2010 data, our Twitter data predicted the winner in 404 out of 435 competitive races”
But this analysis is nowhere in their paper. Fabio Rojas has now posted errata/rebuttals about the op-ed and described this analysis they did here. There are several major issues off the bat:
- They didn’t ever predict 404/435 races; they only analyzed 406 races they call “competitive,” getting 92.5% (in-sample) accuracy, then extrapolated to all races to get the 435 number.
- They’re reporting about in-sample predictions, which is really misleading to a non-scientific audience; more notes on this further below.
- These aren’t predictions from just Twitter data, but a linear model that includes incumbency status and a bunch of other variables. (Noted by Jonathan Nagler, who guessed this even before Rojas posted the errata/rebuttal.)
Given that the op-ed uses their results to proclaim that social media “will undermine the polling industry,” this sort of scrutiny is entirely fair. Let’s take #3. If you look at their Figure 1, as Nagler reproduces, it’s obvious that tweet share alone gives much less than that much accuracy. I’ve reproduced it again and added a few annotations:
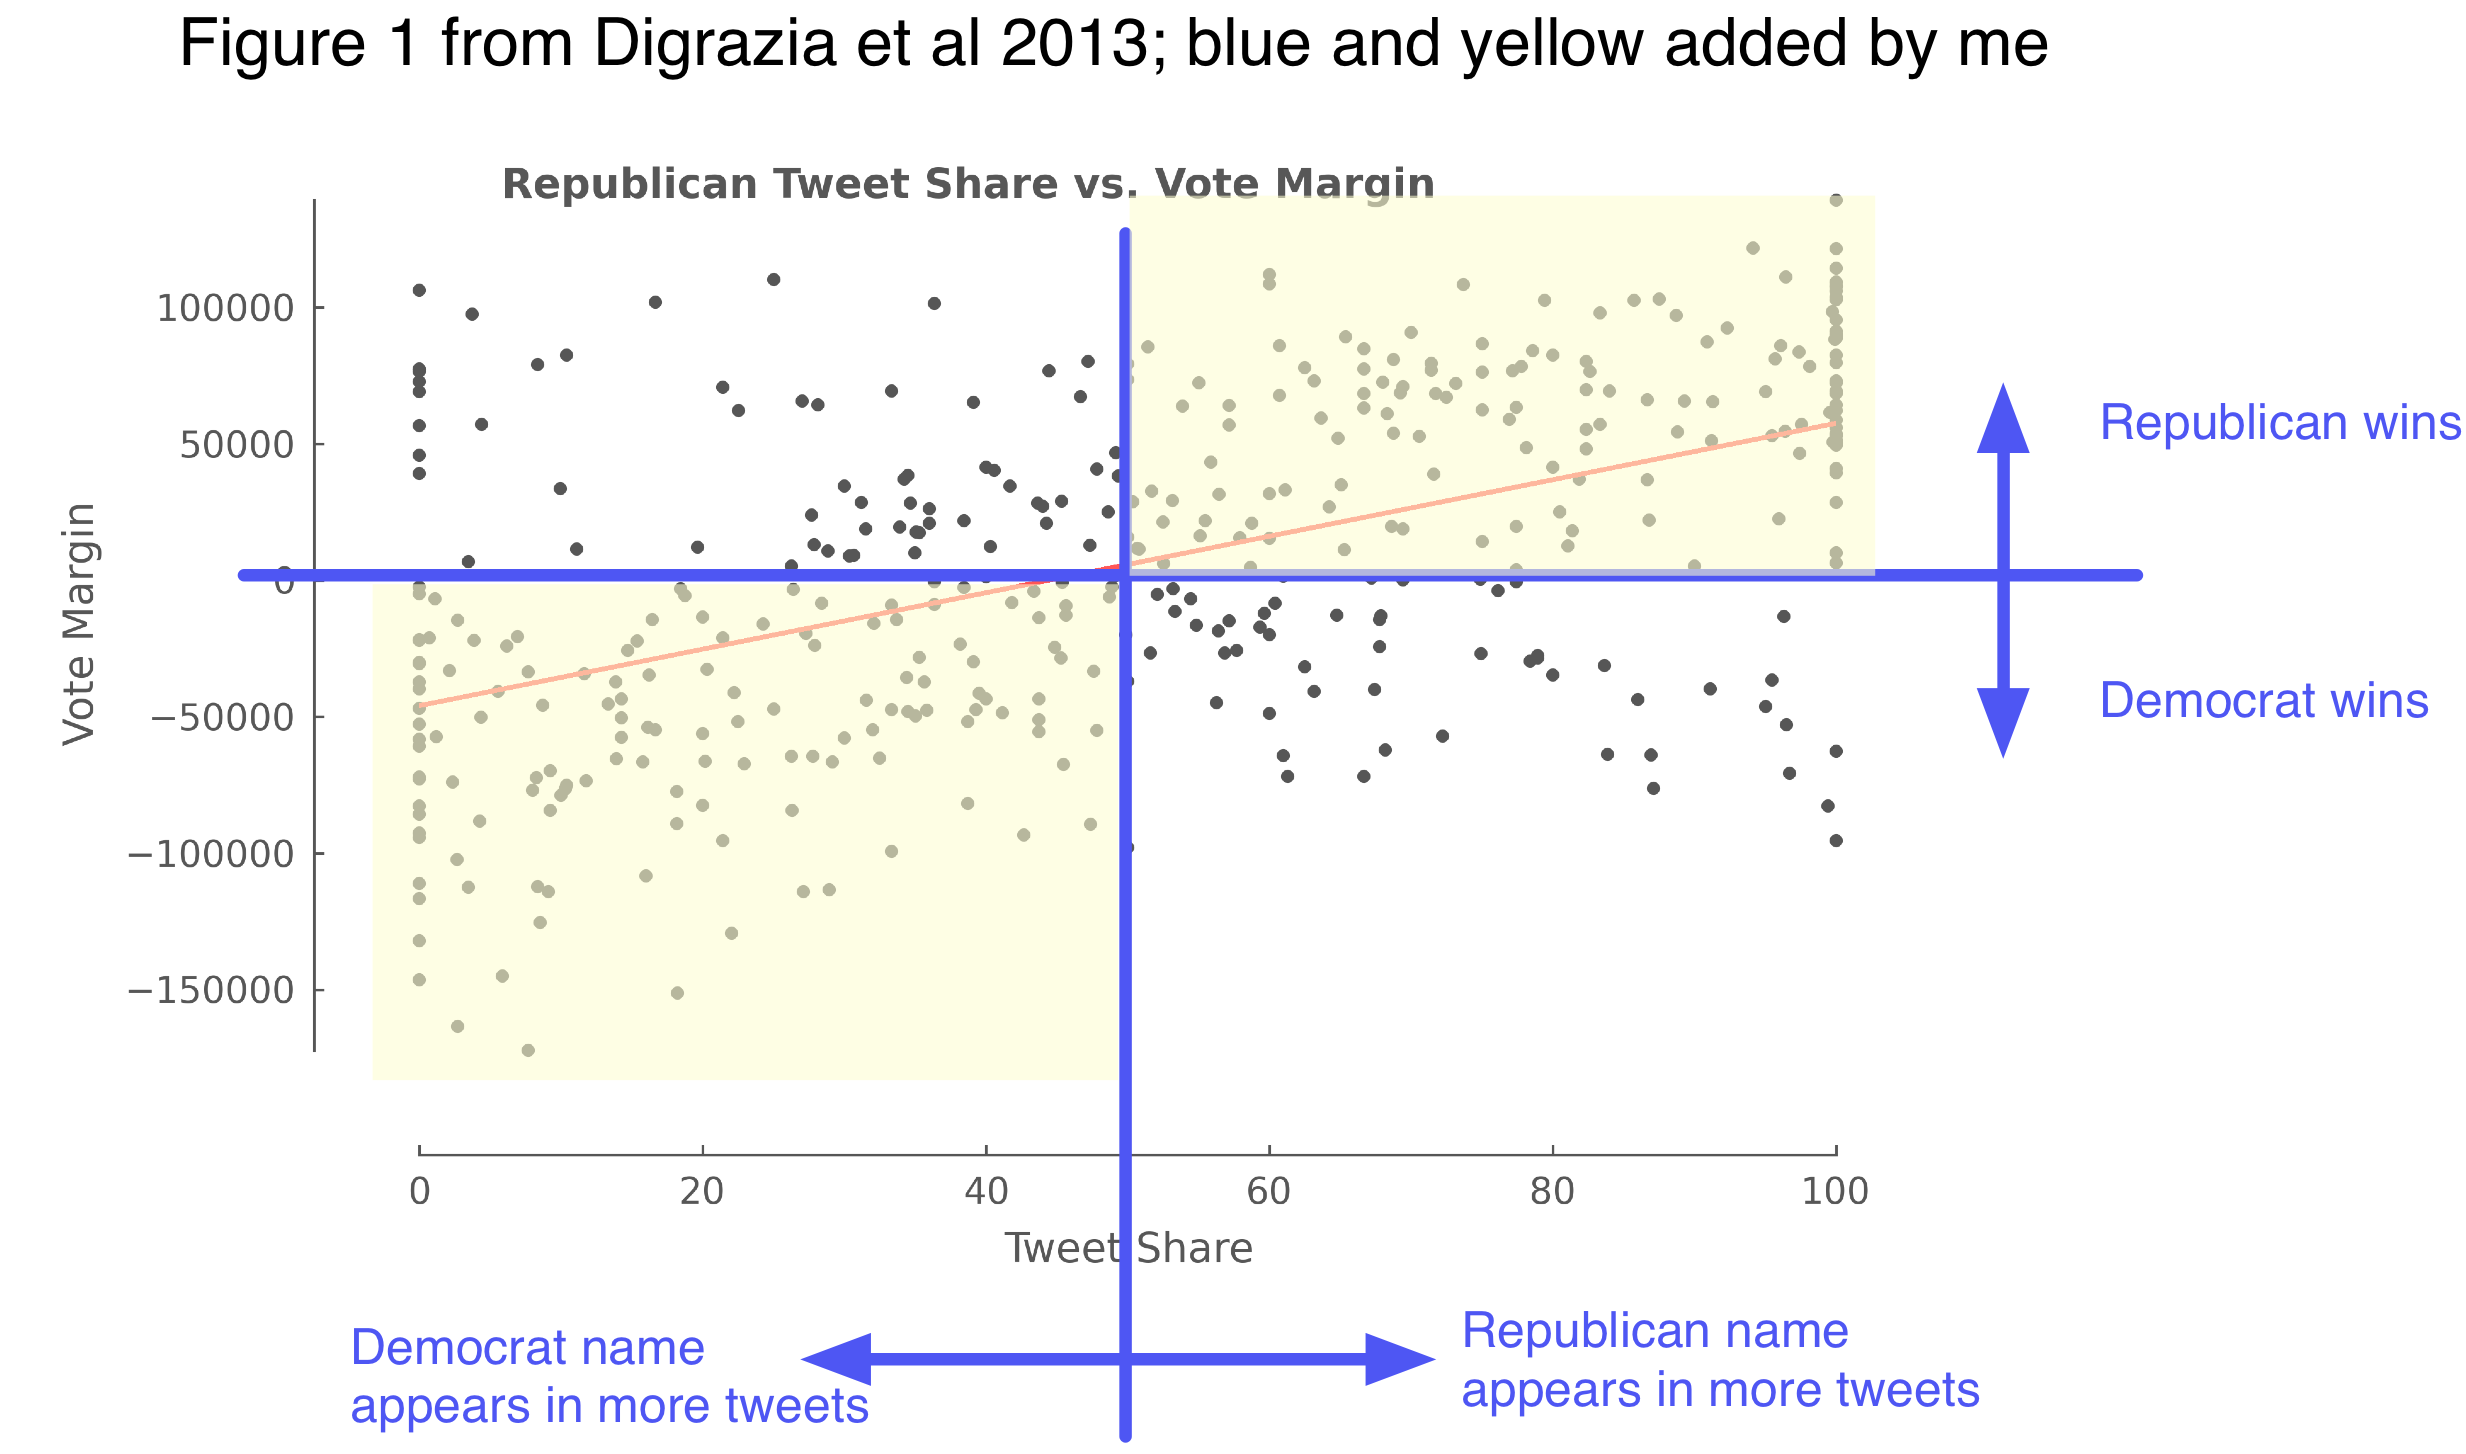
Their original figure is nice and clear. ”Tweet share” is: out of the name mentions of the two candidates in the race, the percentage that are of the Republican candidate. “Vote margin” is: how many more votes the Republican candidate got. One dot per race. Thus, if you say “predict the winner to be whoever got more tweet mentions,” then the number of correct predictions would be the number of dots in the shaded yellow areas, and the accuracy rate are them divided by the total number of dots. This looks like much less than 93% accuracy. [1]
It’s also been pointed out that incumbency alone predicts most House races; are tweets really adding anything here? The main contribution of the paper is to test tweets alongside many controlling variables, including incumbency status. The most convincing analysis the authors could have done would be to add an ablation test: use the model with the tweet share variable, and a model without it, and see how different the accuracies are. This isn’t in the paper. However, we can look at the regression coefficients to get an idea of relative variable importance, and the authors do a nice job reporting this. I took their coefficient numbers from their “Table 1″ in the paper, and plotted them, below:

The effect sizes and their standard errors are on the right. Being the incumbent is worth, on average, 49,000 votes, and it is much more important than all the other variables. One additional percentage point of tweet share is worth 155 votes. [2] The predictive effect of tweet share is significant, but small. In the paper they point out that a standard deviation worth of tweet share margin comes out to around 5000 votes — so roughly speaking, tweet shares are 10% as important as incumbency? [3] In the op-ed Rojas calls this a “strong correlation”; another co-author Johan Bollen called it a “strong relation.” I guess it’s a matter of opinion whether you call Figure 1 a “strong” correlation.
On the other hand, tweet share is telling something that those greyed-out, non-significant demographic variables aren’t, so something interesting might be happening. The paper also has some analysis of the outliers where the model fails. Despite being clearly oversold, this is hardly the worst study of Twitter and elections; I learned something from reading it.
As always, I recommend Daniel Gayo-Avello’s 2012 review of papers on Twitter and election prediction:
… (Update: there’s also a newer review) and also see Metaxas and Mustafaraj (2012) for a broader and higher level overview of social media and elections. (Gayo-Avello also wrote a lengthy but sensible post on this paper.)
Next, point #2 — this “prediction” analysis shares a sadly often-repeated flaw, that the so-called “predictions” are evaluated on the training data (in ML-speak), i.e. they’re in-sample predictions (in socialscience-speak). This is cheating: it’s awfully easy to predict what you’ve already seen! XKCD has a great explanation of election model overfitting. As we should know by now, the right thing to do is report accuracy on an out-of-sample, held-out test set; and the best test is to make forecasts about the future and wait to see if they turn out true.
It’s scientifically irresponsible to take the in-sample predictions and say “we predicted N number of races correctly” in the popular press. It sounds like you mean predicting on new data. Subsequent press articles that Rojas links to use verbs like “foretell” and “predict elections” — it’s pretty clear what people actually care about, and how they’re going to interpret a researcher using the term “prediction.” In-sample predictions are a pretty technical concept and I think it’s misleading to call them “predictions.” [4]
Finally, somewhere in this whole kerfluffle hopefully there’s a lesson about cool social science and press coverage. I feel a little bad for the coauthors given how many hostile messages I’ve seen about their paper on Twitter and various blogs; presumably this motivates what Rojas says at the end of their errata/rebuttal:
The original paper is a non-peer reviewed draft. It is in the process of being corrected, updated, and revised for publication. Many of these criticisms have already been incorporated into the current draft of the paper, which will be published within the next few months.
That sounds great and I look forward to seeing the final and improved version of the paper. But, I feel like in the area of Twitter research, you have to be really cautious about your claims; they will get overblown by readers and the media otherwise. Here, the actual paper is reasonable if limited; the problem is they wrote an op-ed in a major newspaper with incredibly expansive and misleading claims about this preliminary research! This is going to bring out some justifiable criticism from the scientific community, I’m afraid.
[1] Also weird: many of the races have a 100% tweet share to one candidate. Are the counts super low, like 3-vs-0? Does it need smoothing or priors? Are these from astroturfing or spamming efforts? Do they create burstiness/overdispersion? Name mention frequency is an interesting but quite odd sort of variable that needs more analysis in the future.
[2] These aren’t literal vote counts, but number of votes normalized by district size; I think it might be interpretable as, expected number of votes in an average-sized city. Some blog posts have complained they don’t model vote share as a percentage, but I think their normalization preprocessing actually kind of handles that, albeit in a confusing/non-transparent way.
[3] I guess we could compare the variables’ standardized coefficients. Incumbency as a 0-1 indicator, for 165 Republican incumbents out of 406 total in their dataset, is stdev ~ 0.5; so I guess that’s more like, a standardized unit of tweet share is worth 20% of standardized impact of incumbency? I’m not really sure what’s the right way to compare here… I still think difference in held-out accuracy on an ablation test is the best way to tell what’s going on with one variable, if you really care about it (which is the case here).
[4] I wish we had a different word for “in-sample predictions,” so we can stop calling them “predictions” to make everything clearer. They’re still an important technical concept since they’re very important to the math and intuitions of how these models are defined. I guess you could say “yhat” or “in-sample response variable point estimate”? Um, need something better… Update: Duh, how about “fitted value” or “in-sample fits” or “model matched the outcome P% of the time”… (h/t Cosma)
[5] Numbers and graphics stuff I did are here.
Pingback: The Signal and the Noise in Middle East Elections | The Presidency