Statistics vs. Machine Learning, fight!

10/1/09 update — well, it’s been nearly a year, and I should say not everything in this rant is totally true, and I certainly believe much less of it now. Current take: Statistics, not machine learning, is the real deal, but unfortunately suffers from bad marketing. On the other hand, to the extent that bad marketing includes misguided undergraduate curriculums, there’s plenty of room to improve for everyone.


So it’s pretty clear by now that statistics and machine learning aren’t very different fields. I was recently pointed to a very amusing comparison by the excellent statistician — and machine learning expert — Robert Tibshiriani. Reproduced here:

Glossary

Machine learning Statistics

network, graphs model

weights parameters

learning fitting

generalization test set performance

supervised learning regression/classification

unsupervised learning density estimation, clustering

large grant = $1,000,000 large grant = $50,000

nice place to have a meeting:
Snowbird, Utah, French Alps
nice place to have a meeting:
Las Vegas in August

Hah. Or rather, ouch! I had two thoughts reading this. (1) Poor statisticians. Machine learners invent annoying new terms, sound cooler, and have all the fun. (2) What’s wrong with statistics? They have way less funding and influence than it seems they might deserve.

There are several issues going on here, both substantive and cultural: Continue reading

132 Comments

Calculating running variance in Python and C++

It’s fairly obvious that an average can be calculated online, but interestingly, there’s also a way to calculate a running variance and standard deviation. Read all about it here.

I’m playing around with the Netflix Prize data of 100 million movie ratings, and a huge problem is figuring out how to load and calculate everything in memory. I’m having success with NumPy, the numeric library for Python, because it compactly stores arrays with C/Fortran binary layouts. For example, 100 million 32-bit floats = 100M * 4 = 400MB of memory, which is manageable. And it’s much easier to play around interactively in ipython/matplotlib rather than write C++ for everything.

Unfortunately, the simple ways to calculate variance on an array of that size create wasteful intermediate data structures as long as the original array.

>>> mean( (x-mean(x)) ** 2 )            # two intermediate structures
>>> tmp=x-mean(x); tmp**=2; mean(tmp)   # one intermediate structure

That’s an extra 400 or 800 megs of memory being thrown around. (And if x was an array of integers, the x-mean(x) step implicitly converts to 64-bit doubles which, well, doubles things again!)

So, following John Cook’s explanation, I wrote running_stat, a C++ and Python implementation of running variance. It takes almost no memory and is faster than NumPy’s native variance function. Demo:

In [1]: from numpy import *
In [2]: x = arange(1e8)                      # python RSIZE = 774 MB

In [3]: timeit -n1 -r5 std(x)                # RSIZE goes as high as 2.2 GB
1 loops, best of 5: 4.01 s per loop

In [4]: import running_stat
In [5]: timeit -n1 -r5 running_stat.std(x)   # RSIZE = 774 MB the whole time
1 loops, best of 5: 1.66 s per loop

The C++ implementation is very simple and can be ripped out of running_stat.cc.

Link: github.com/brendano/running_stat

I wonder if Haskell’s laziness, perhaps along with my friend Patrick’s Haskell BLAS bindings, might magically solve some of the memory usage in the naive implementation.

5 Comments

Python bindings to Google’s “AJAX” Search API

I couldn’t find this anywhere on the web, so I threw together a quick Python binding for Google’s “AJAX” Search API (or rather, JSON-over-HTTP).  (There are bindings out there for the old SOAP interface; I heard that was discontinued though.)

Nothing fancy but it works for me.  At: gist.github.com/28405

Leave a comment

Netflix Prize

Here’s a fascinating NYT article on the Netflix Prize for a better movie recommendation system.  Tons of great stuff there; here’s a few highlights …

First, a good unsupervised learning story:

There’s a sort of unsettling, alien quality to their computers’ results. When the teams examine the ways that singular value decomposition is slotting movies into categories, sometimes it makes sense to them — as when the computer highlights what appears to be some essence of nerdiness in a bunch of sci-fi movies. But many categorizations are now so obscure that they cannot see the reasoning behind them. Possibly the algorithms are finding connections so deep and subconscious that customers themselves wouldn’t even recognize them. At one point, Chabbert showed me a list of movies that his algorithm had discovered share some ineffable similarity; it includes a historical movie, “Joan of Arc,” a wrestling video, “W.W.E.: SummerSlam 2004,” the comedy “It Had to Be You” and a version of Charles Dickens’s “Bleak House.” For the life of me, I can’t figure out what possible connection they have, but Chabbert assures me that this singular value decomposition scored 4 percent higher than Cinematch — so it must be doing something right. As Volinsky surmised, “They’re able to tease out all of these things that we would never, ever think of ourselves.” The machine may be understanding something about us that we do not understand ourselves.

Well, I’m pretty suspicious of drawing conclusions from that single example — it could have been a genuine grouping error while different, better groupings elsewhere were responsible for that 4 percent gain.  That’s why I’m a fan of systematically evaluating unsupervised algorithms; for example, as in political bias and SVD.

Another bit: suspicions that demographics might be less useful than individual movie preferences:

Interestingly, the Netflix Prize competitors do not know anything about the demographics of the customers whose taste they’re trying to predict. The teams sometimes argue on the discussion board about whether their predictions would be better if they knew that customer No. 465 is, for example, a 23-year-old woman in Arizona. Yet most of the leading teams say that personal information is not very useful, because it’s too crude. As one team pointed out to me, the fact that I’m a 40-year-old West Village resident is not very predictive. There’s little reason to think the other 40-year-old men on my block enjoy the same movies as I do. In contrast, the Netflix data are much more rich in meaning. When I tell Netflix that I think Woody Allen’s black comedy “Match Point” deserves three stars but the Joss Whedon sci-fi film “Serenity” is a five-star masterpiece, this reveals quite a lot about my taste. Indeed, Reed Hastings told me that even though Net­flix has a good deal of demographic information about its users, the company does not currently use it much to generate movie recommendations; merely knowing who people are, paradoxically, isn’t very predictive of their movie tastes.

Though I would like to see the results for throwing in demographics as features versus not.  It’s a little annoying that so many of the claims in the article aren’t backed up by empirical evidence — which you’d think would be the norm for such a data-driven topic!

Finally, an interesting question:

Hastings is even considering hiring cinephiles to watch all 100,000 movies in the Netflix library and write up, by hand, pages of adjectives describing each movie, a cloud of tags that would offer a subjective view of what makes films similar or dissimilar. It might imbue Cinematch with more unpredictable, humanlike intelligence.

At the very least, I bet that would help Cinematch by supplying a new data source that’s unlike the current ones they have — always a good move.  As for “humanlike” — well, computational intelligence is a tough game to be in!

4 Comments

The Wire: Mr. Nugget

One of my favorite scenes of wisdom from The Wire:

D: Nigga please. The man who invented them things, just some sad ass down at the basement of McDonald’s, thinkin’ of some shit to make some money for the real playas.

POOT: Nah, man, that ain’t right.

D: Fuck right.  It ain’t about right, it’s about money.  Now you think Ronald McDonald go down to that basement and say “Hey Mr. Nugget, you da bomb, we sellin’ chicken faster than you can tear the bone out, so I’m gonna write my clowney-ass name on this fat-ass check for you?”

Leave a comment

Correlations – cotton picking vs. 2008 Presidential votes

From the neat blog Strange Maps — a map of the U.S. South, overlaying where cotton was picked in 1860 versus Presidential voting in 2008.  The claim is that the causal pathway is through high African-American populations.

Leave a comment

Disease tracking with web queries and social messaging (Google, Twitter, Facebook…)

This is a good idea: in a search engine’s query logs, look for outbreaks of queries like [[flu symptoms]] in a given region.  I’ve heard (from Roddy) that this trick also works well on Facebook statuses (e.g. “Feeling crappy this morning, think I just got the flu”).

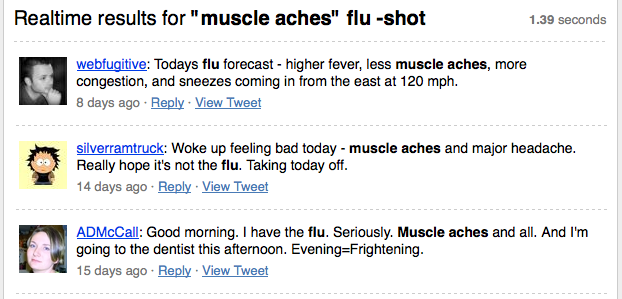
For an example with a publicly available data feed, these queries works decently well on Twitter search:

[[ flu -shot -google ]] (high recall)

[[ "muscle aches" flu -shot ]] (high precision)

The “muscle aches” query is too sparse and the general query is too noisy, but you could imagine some more tricks to clean it up, then train a classifier, etc.  With a bit more work it looks like geolocation information can be had out of the Twitter search API.

3 Comments

Obama street celebrations in San Francisco

In San Francisco, it’s no secret who everyone wanted to win in this election.  Shortly after Obama’s victory speech last night, people started celebrating in the streets near my house in the Mission.  At Valencia and 19th, a big party formed and ran for several hours into the night.

People and kids were cheering, high-fiving, playing music, and having a good time:

Shades of Burning Man: There were happy combinations of alcohol, police, art cars, fireworks, and the Extra Action Marching Band.

(That clip was the tensest situation I saw; after that, the police just moved everyone out of the intersection and watched carefully.)

I yelled “Yes we can!” and was answered “Yes we DID!”  Strangers hugged me.  I went home at 1 a.m. and the party was still going strong. Not the worst way to celebrate making history.

This election was also big locally, including a tight three-way race for the local district chair, plus dozens of city and state propositions.  The one sad point last night was lingering uncertainty over California Prop 8 — to ban same-sex marriage — which looked like it would win.  I know people who arranged last minute marriages over the past week as Prop 8 polled strong; they now have horrible uncertainty about their rights and their future.  It was a very mixed evening.

(I uploaded several other videos; click here to see them all. More videos and pictures from other people here.)

3 Comments

Twitter graphs of the debate

Fascinating, from the Twitter blog:

1 Comment

Is religion the opiate of the elite?

Andrew Gelman claims religion is the “opiate of the elite,” from this graph:

Opiate of the elite

He says:

Religious attendance predicts Republican voting much more among the rich than the poor.

This is a really interesting phenomenon — condition on wealth and see different effects of religion.

But from looking at that graph, I saw the flipped interpretation — condition on religion, then see different effects of wealth (each line has a different slope).  Only the religious become more Republican with greater wealth; secular voters don’t change their preferences when they get rich.

Leave a comment